
Kiwifruit · Variable rate
Variable rate in kiwifruit
Put fertiliser where each part of the block needs it, and prove it went on. Follow one example block from the soil test to the spreader and back.
Put fertiliser where each part of the block needs it, and prove it went on. Follow one example block from the soil test to the spreader and back.
One example block: 4.0 ha of gold kiwifruit. Under the canopy every part of a block is different. Test it properly and each part can get what it needs, rather than one average rate for the lot.
Round again: what monitoring shows sets next season’s rates.
Most blocks are tested with a transect: a zig-zag walk across the block, with every plug in one bag. A grid tests the same block at 16 points, and each one is bagged and analysed on its own.
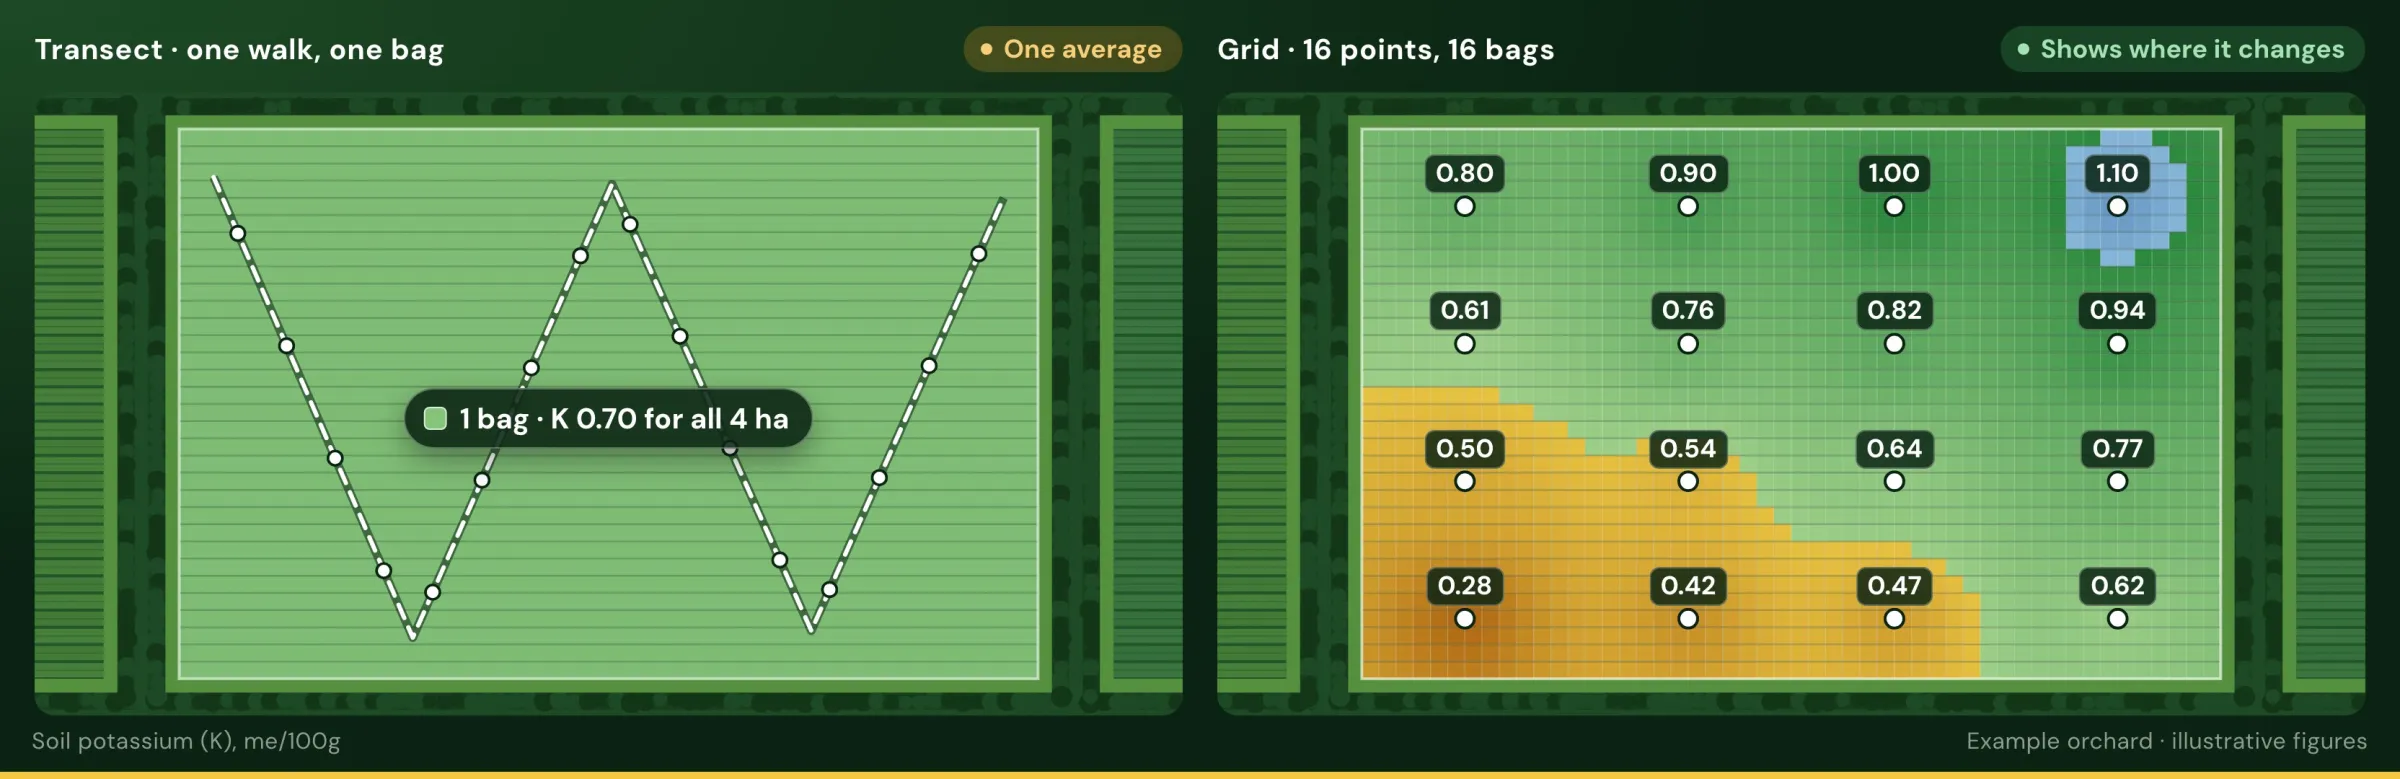
One walk, one bag of plugs, one number for all 4.0 ha: K 0.70. A good average, but it can’t tell you where.
16 points, each in its own bag. Now you can see the low corner that needs more and the high strip that already has plenty.
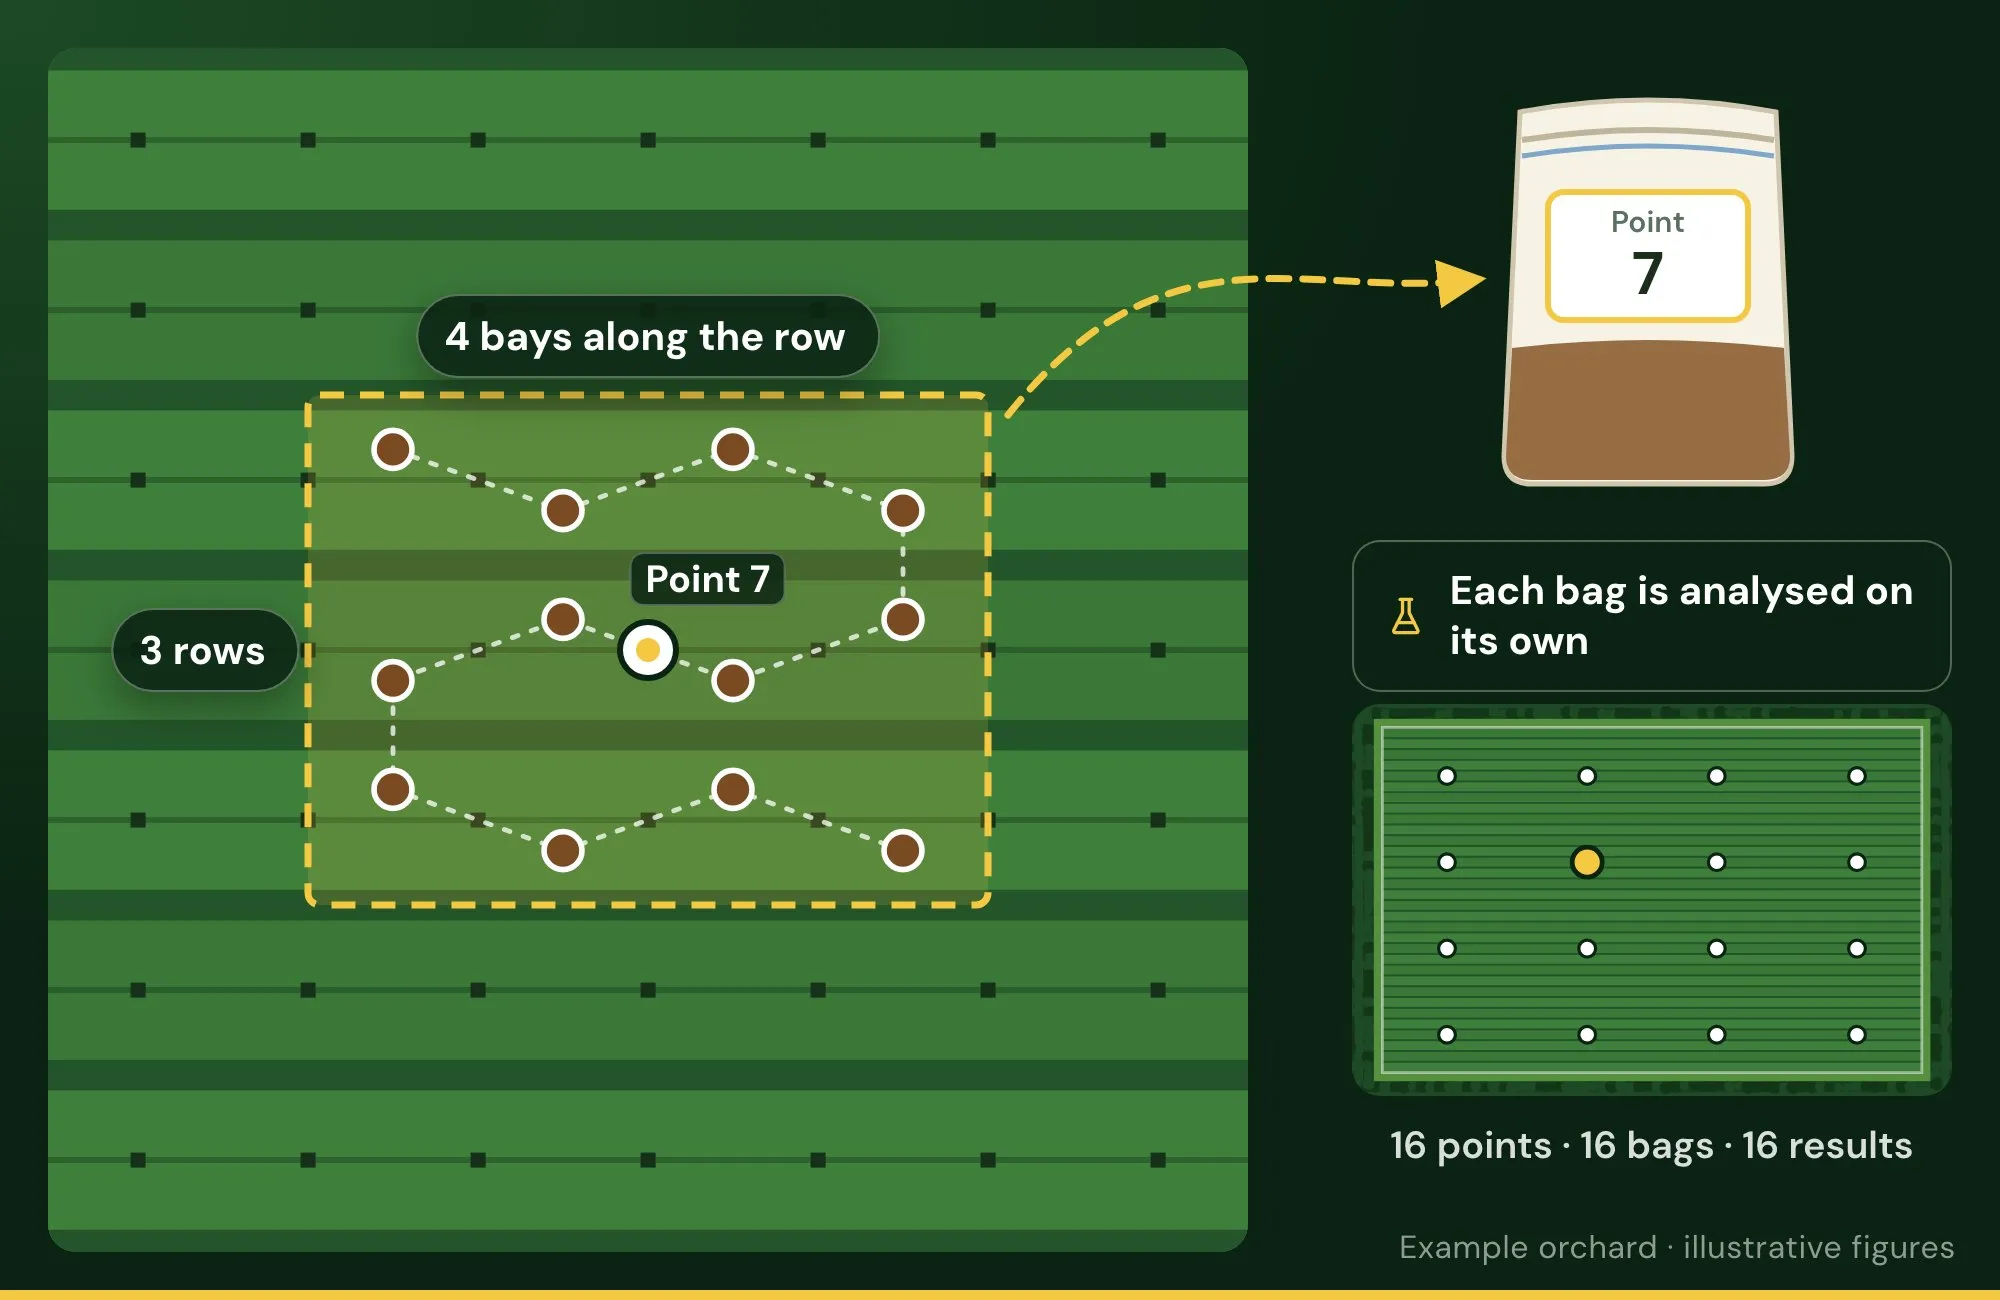
The lab results are imported against each grid point, and every nutrient gets its own map. Deficient, in range and excess stand out at a glance, graded against the consultancy’s own ranges.
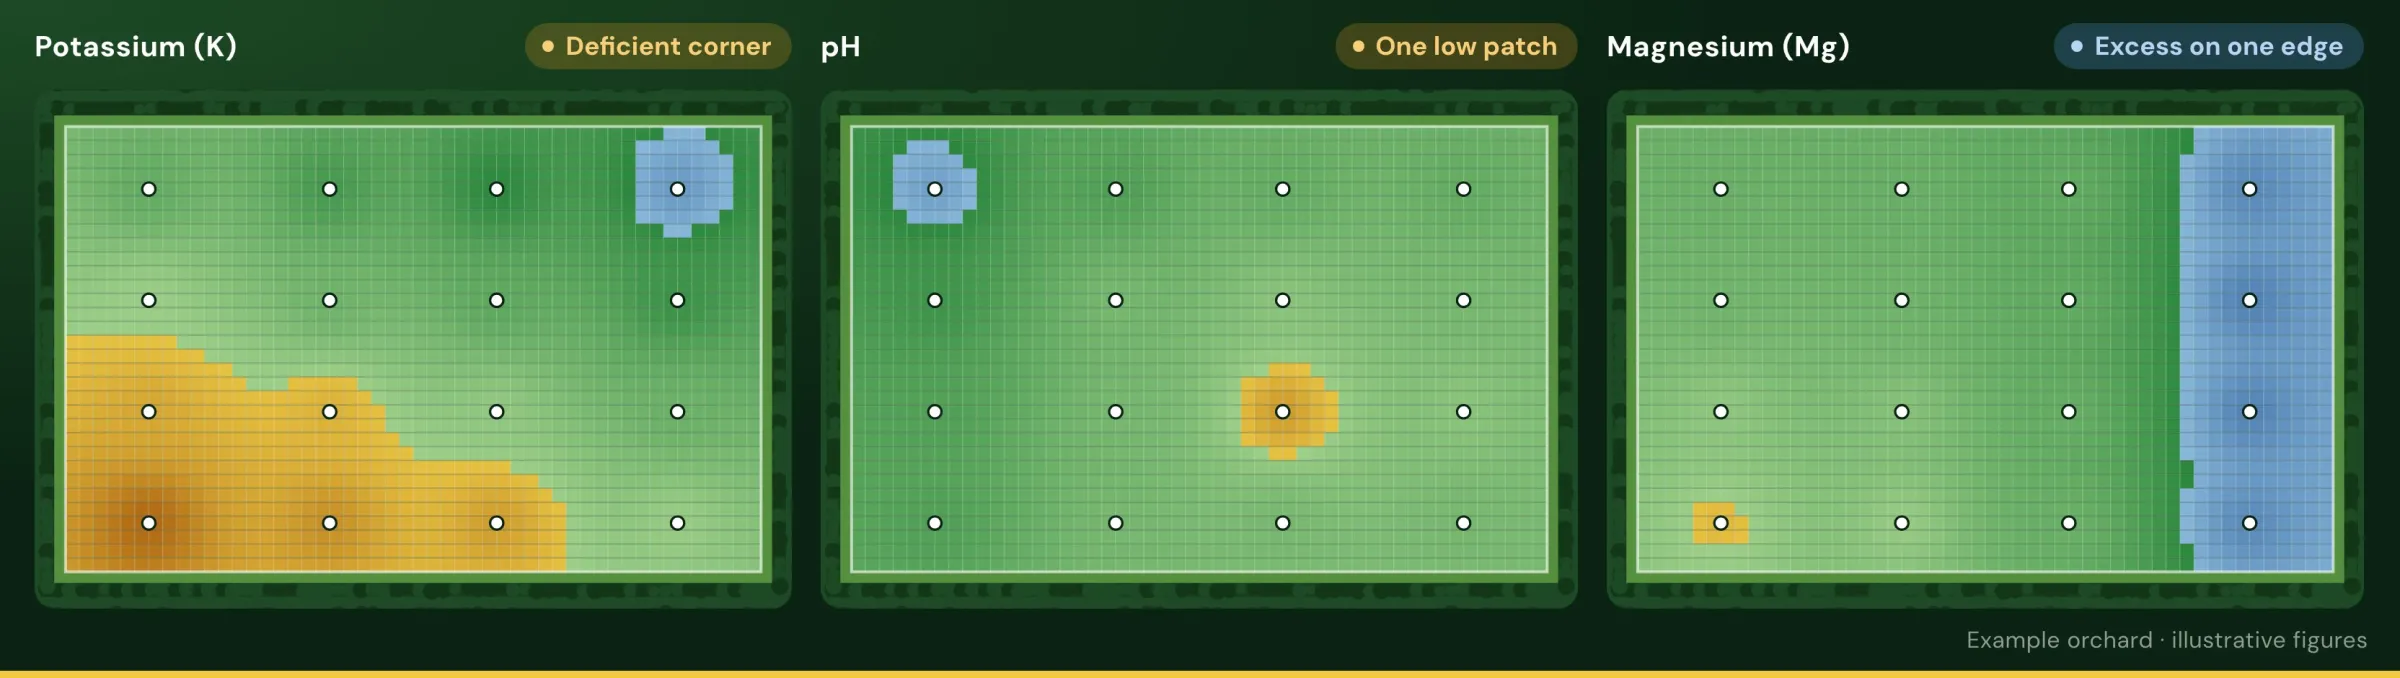
The patterns don’t line up. That’s why each nutrient gets its own decision, and why one average for the block can hide what’s going on.
Every result on the map, with the block’s history, so the highs and lows are easy to see.
Writes the recommendation and the annual plan, from the data and what they know of the orchard and the grower’s goals.
Turns the advisor’s rates into a rate map, sends it to the spreader and brings the proof back.
The ranges are the consultancy’s. What counts as deficient, in range or in excess is set by the consultancy, not the platform.
Nothing is prescribed automatically. The platform never writes a recommendation or an annual plan by itself. It makes a better-informed call quicker and easier.
From the potassium map, the advisor sets a potash rate for each band of soil K. The block is split into 10 m cells, and each cell gets the rate for its result.
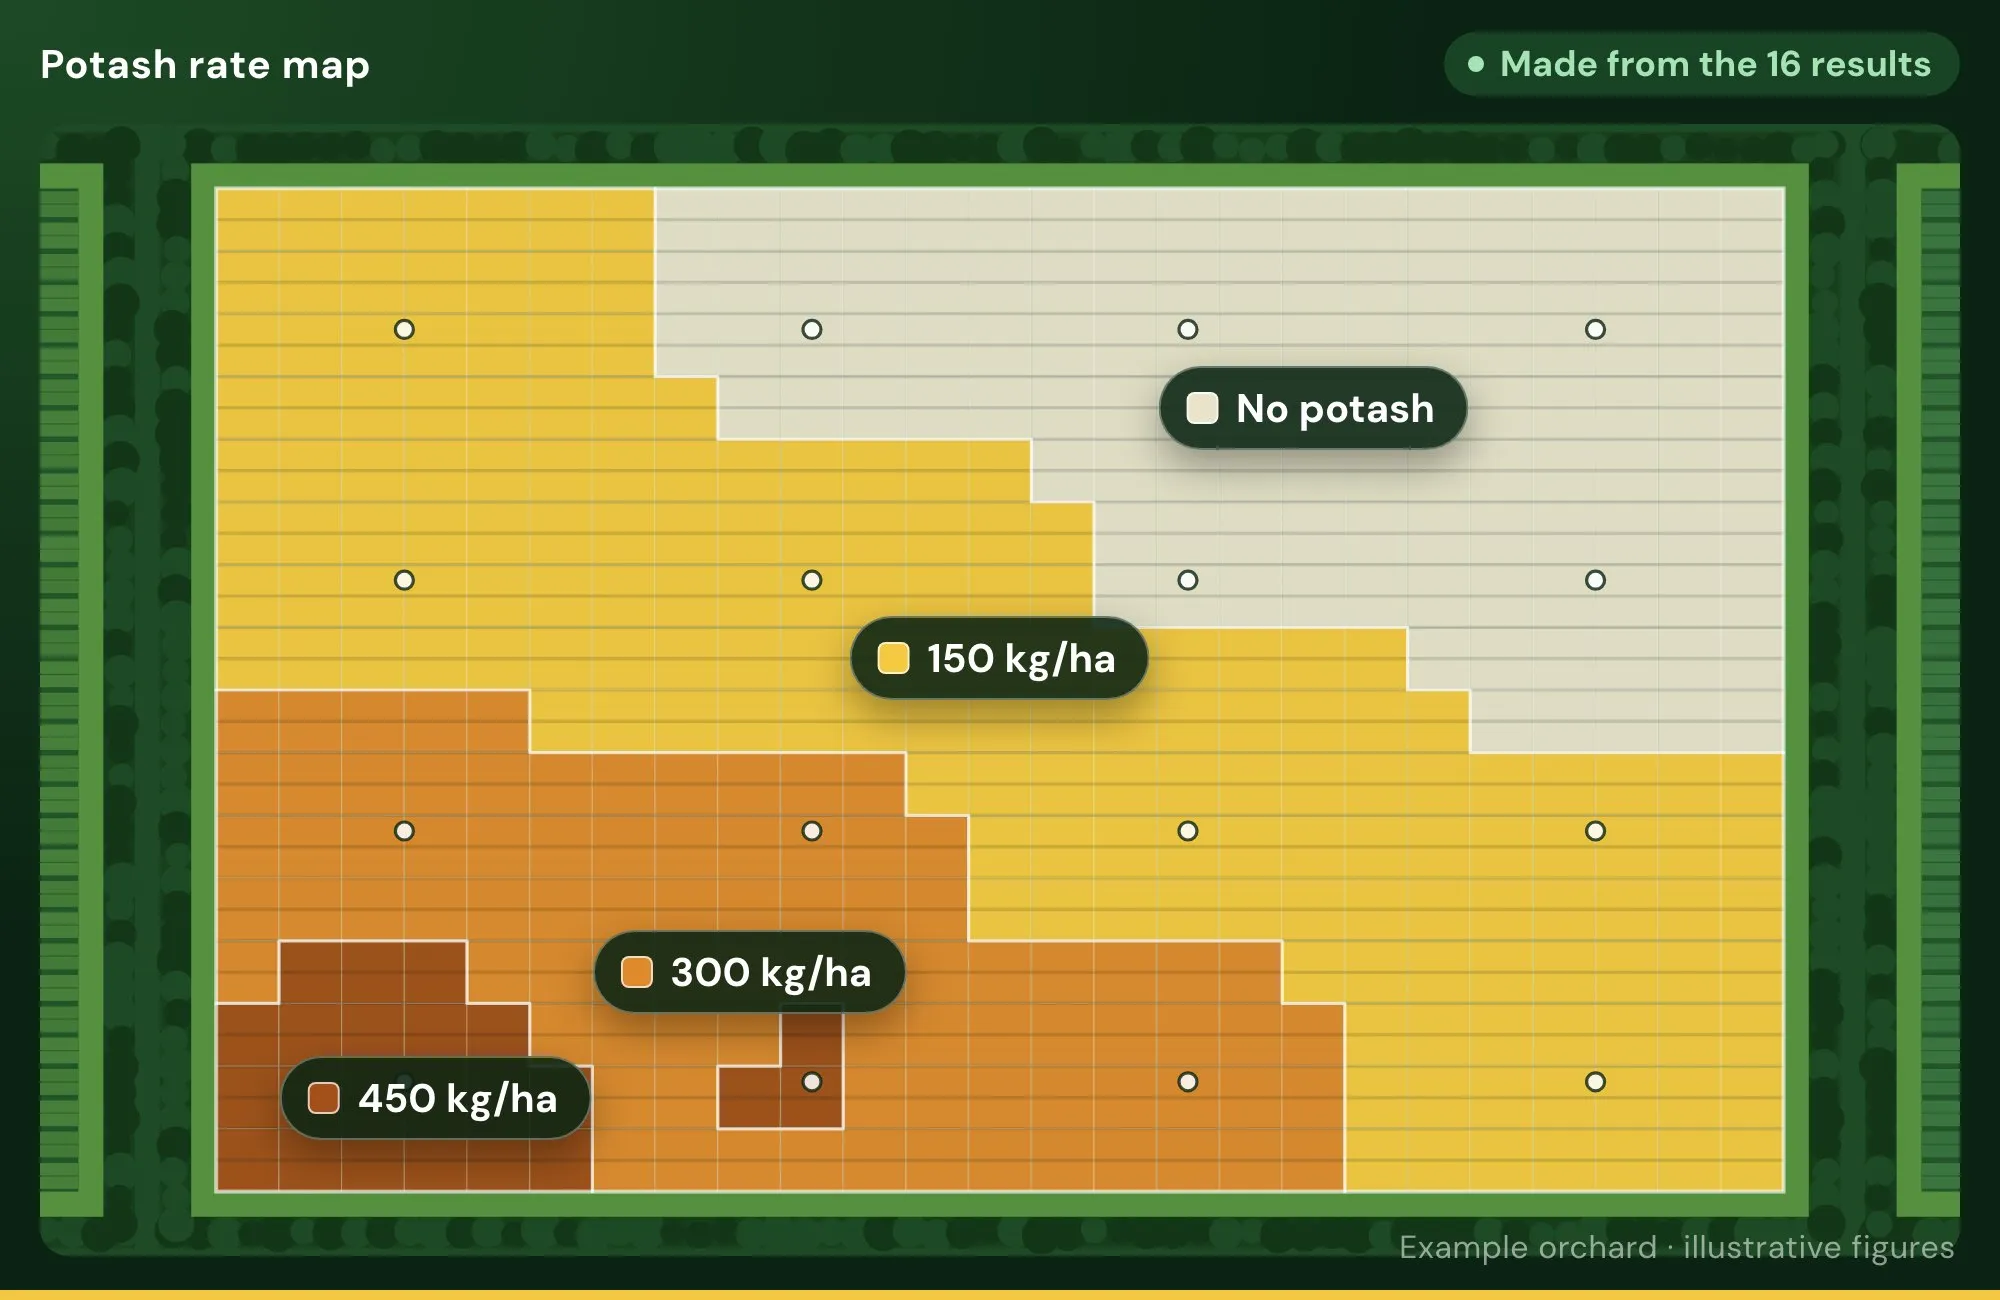
| Soil K | Area | Rate | Potash |
|---|---|---|---|
| Below 0.45 | 0.23 ha | 450 kg/ha | 104 kg |
| 0.45 – 0.60 | 0.88 ha | 300 kg/ha | 264 kg |
| 0.60 – 0.80 | 1.73 ha | 150 kg/ha | 260 kg |
| 0.80 and over | 1.16 ha | None | 0 kg |
| Total | 4.00 ha | 628 kg |
The rates are the advisor’s call for the crop. The map just puts each rate where it belongs.
In the clip: 300 → 450 → 300 → 150 kg/ha along one row
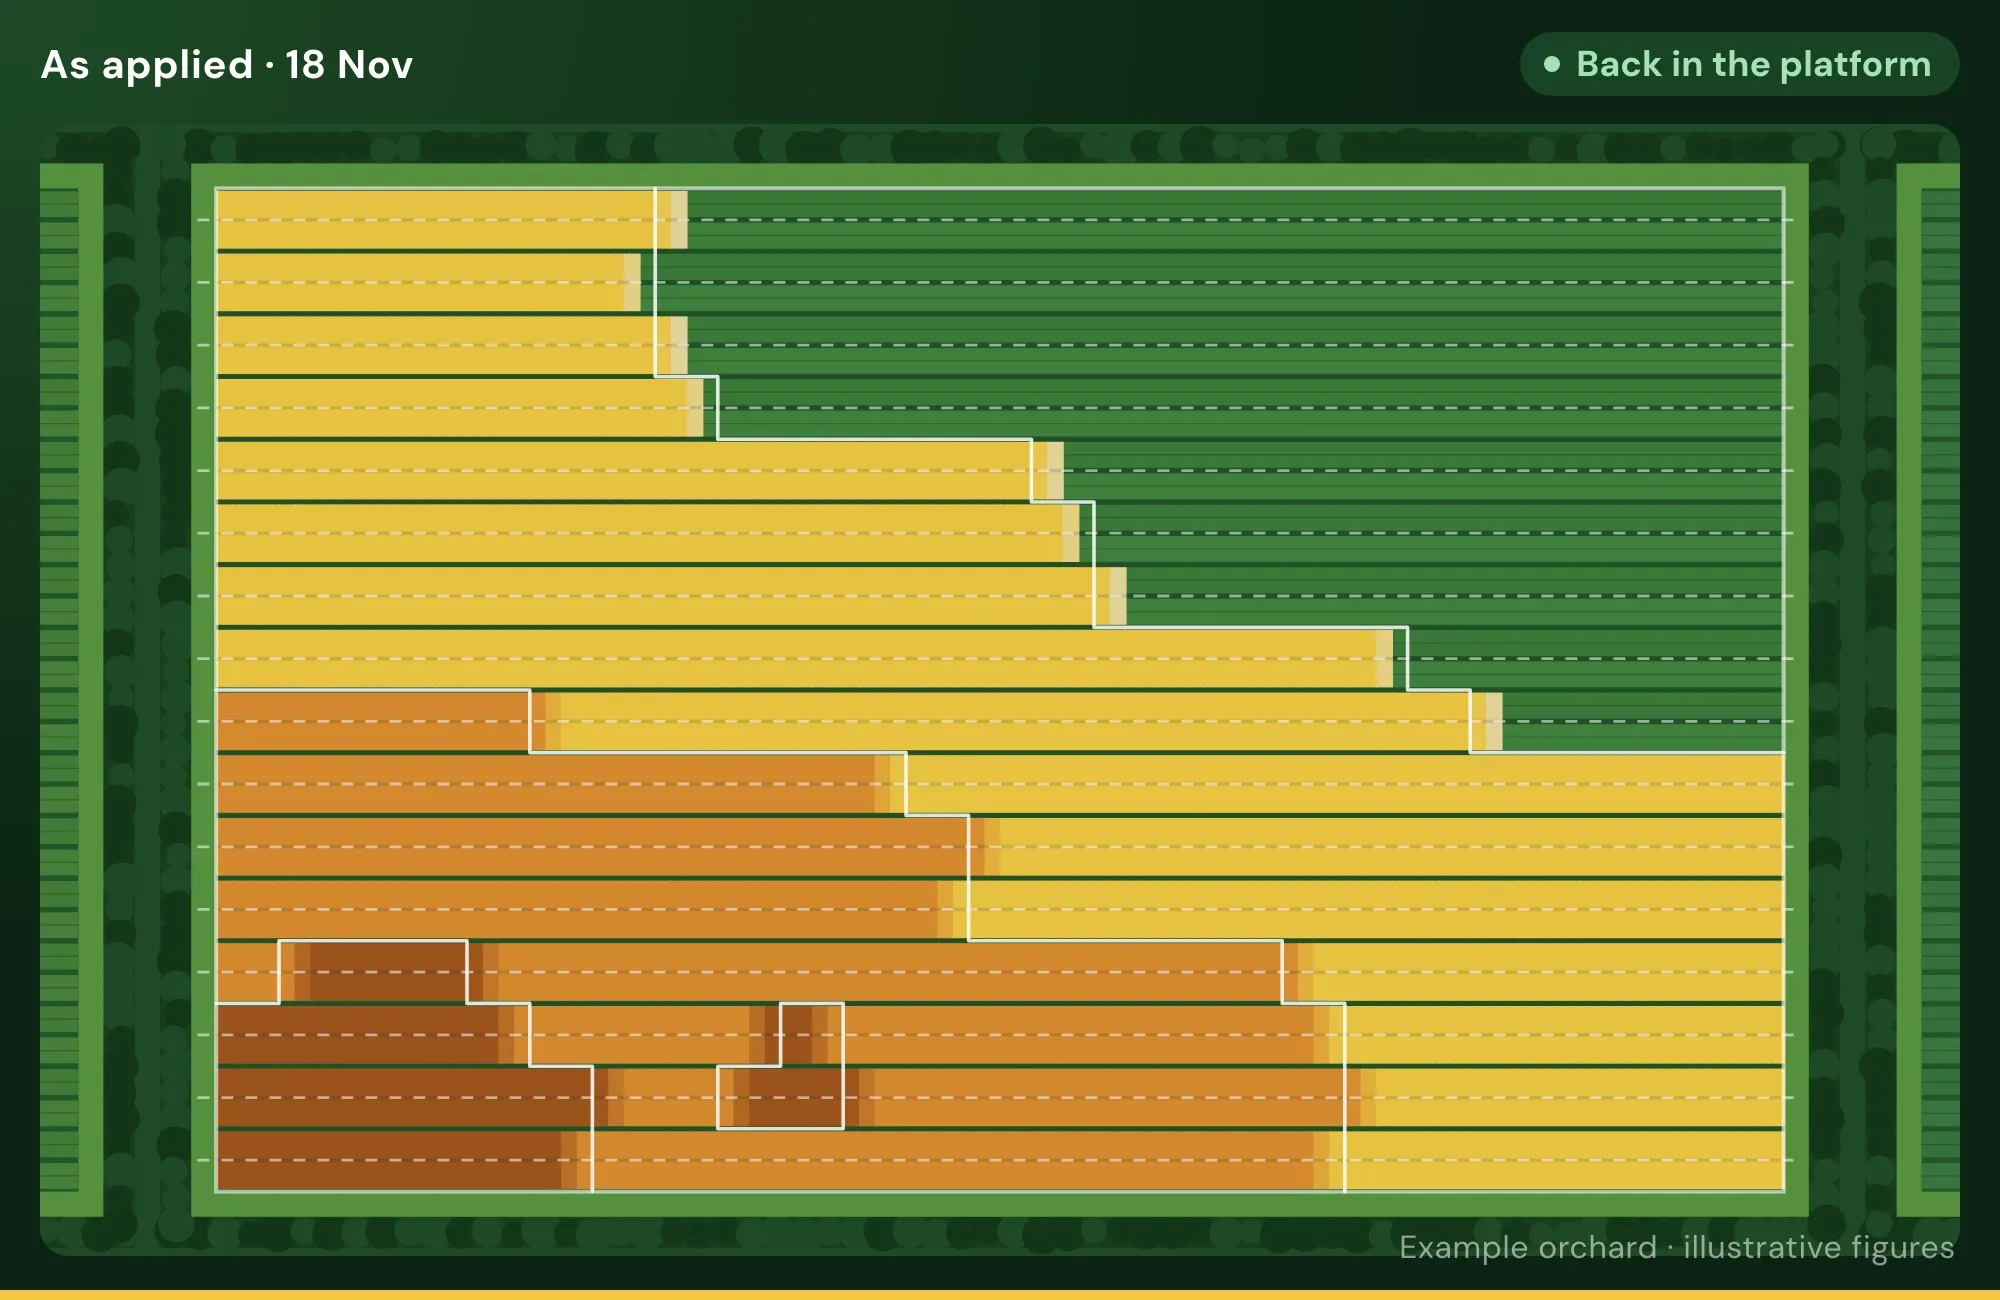
With only the transect’s 0.70 to go on, 150 kg/ha everywhere is the sensible call. Lay that flat rate over what the grid found.
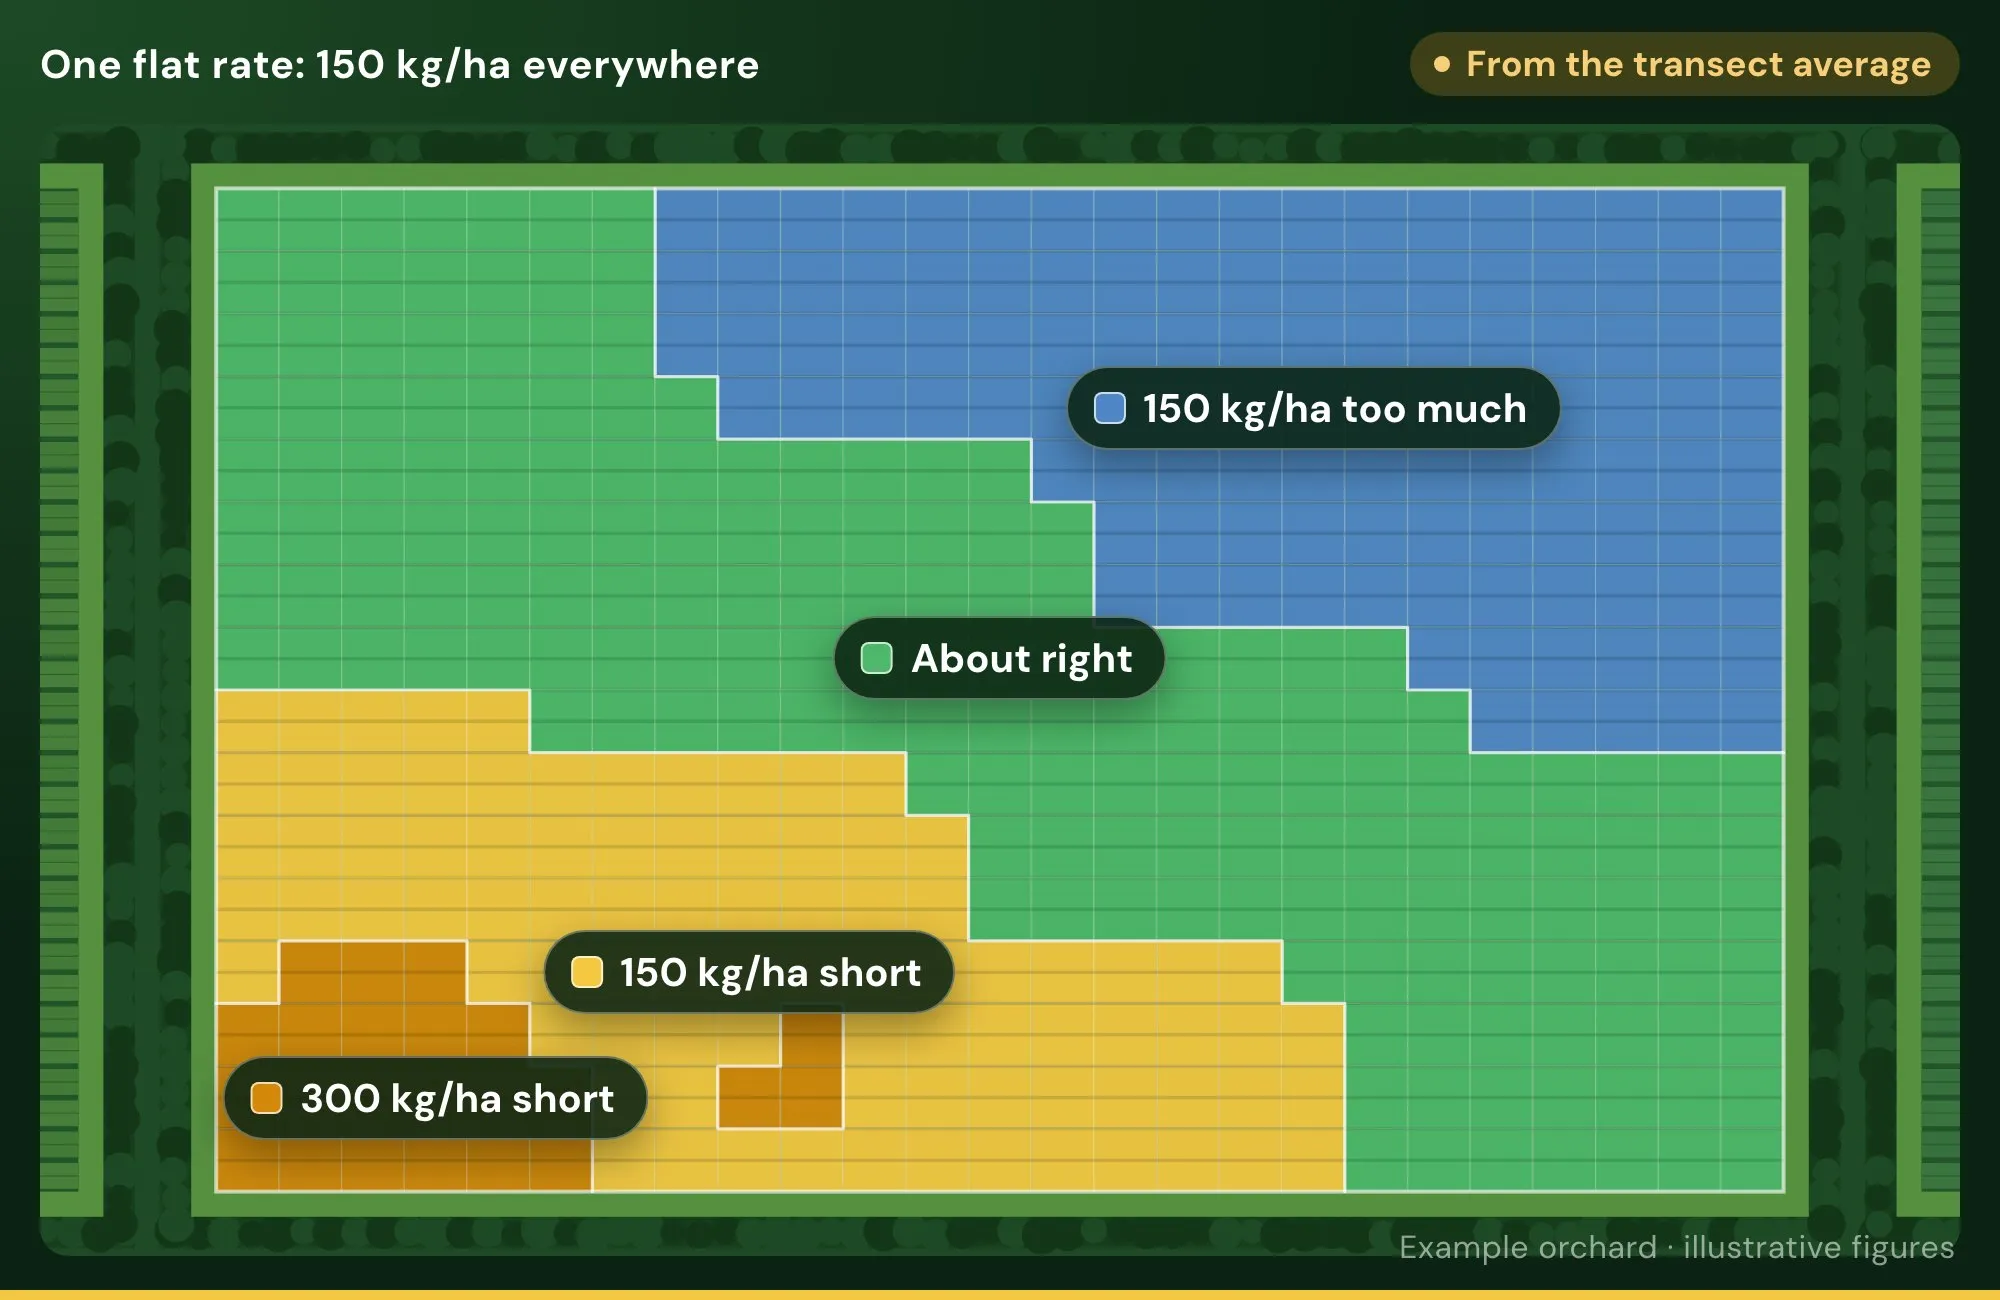
174 kg on 1.16 ha that didn’t need it, and 1.11 ha left 201 kg short.
All of it where the soil test said it was needed.
| Soil K | Area | Transect | Grid |
|---|---|---|---|
| Below 0.45 | 0.23 ha | 150 | 450 |
| 0.45 – 0.60 | 0.88 ha | 150 | 300 |
| 0.60 – 0.80 | 1.73 ha | 150 | 150 |
| 0.80 and over | 1.16 ha | 150 | 0 |
On some blocks the grid saves product, and on others it uses a little more. Either way, it goes where it does some good.
Straight fertilisers in place of mixed products where possible, then side dressings at key points in the season. A mix moves every nutrient up and down together; with straights, each nutrient can follow its own rate map.
Two to three passes of straight products
Each follows its own rate map, moving every part of the block towards the optimum range.
YaraMila Complex Blend or Advantage Bud Break
Supports strong early growth as the vines come out of dormancy.
Yara Rega or Advantage Pre-Flower
YaraLiva Nitrabor + SOP
Key nutrients for cell division, flowering and fruit set.
YaraMila Complex or Advantage Post-Flower
Where required, for dry matter, fruit sizing and crop load.
An example only. The products, rates and timing are always the advisor’s call.
You don’t need a full grid every year. A few of the same grid points are re-tested each year as monitoring samples, then a full grid redraws the map every four to five years.
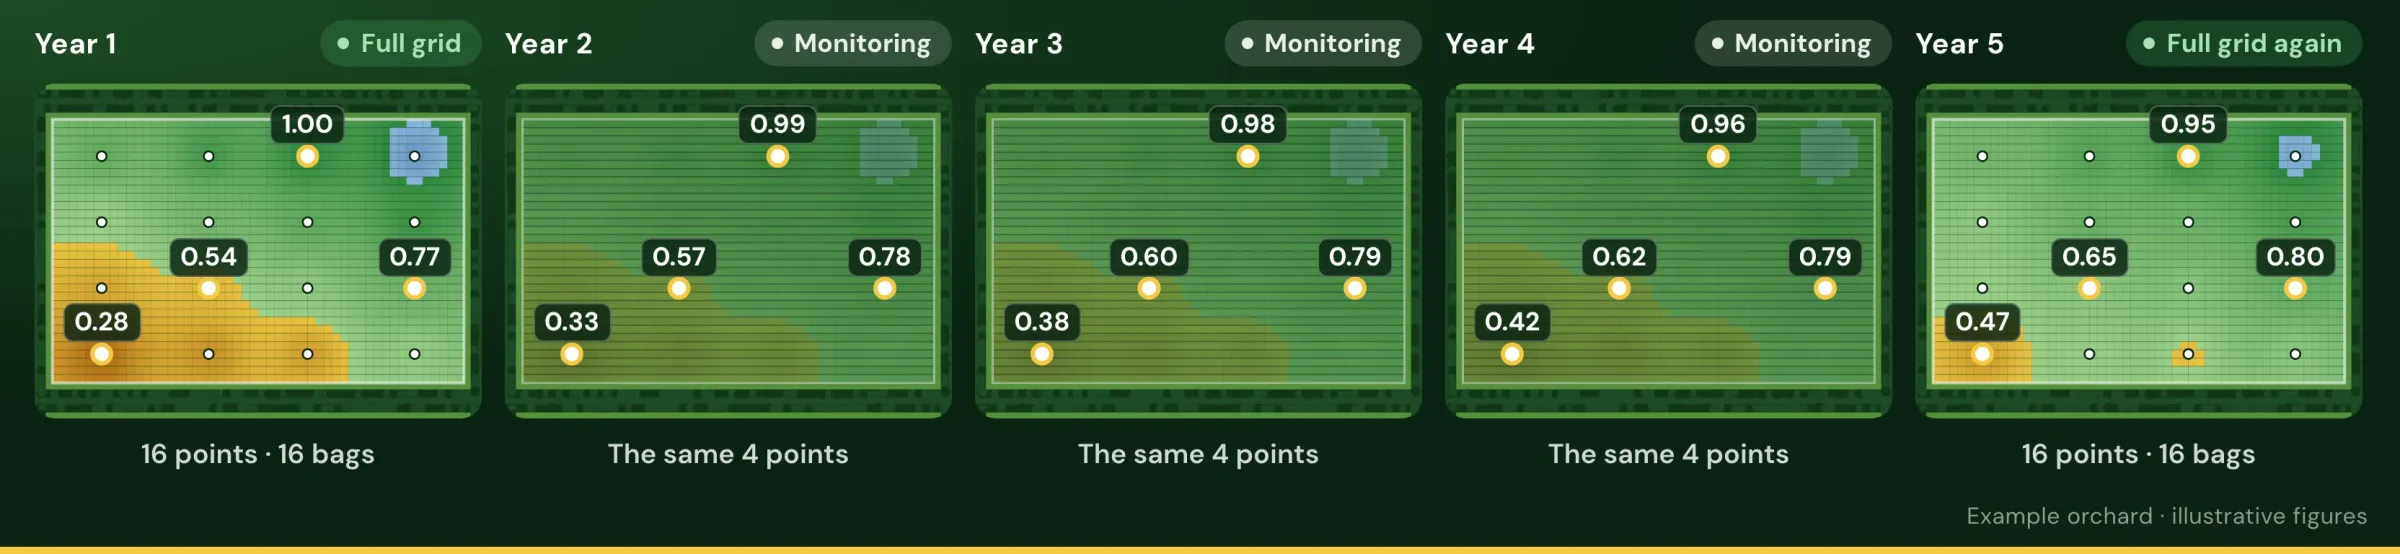
Every point tested. This sets the map and the first rate map.
The same four grid points, one in each rate zone, so the numbers compare like for like. The low corner climbs: 0.28 → 0.33 → 0.38 → 0.42.
Every 4–5 years, a full grid redraws the whole map.
We’ll follow an example orchard from the grid test to proof of application, then talk about your business.
Example orchard · illustrative figures, not agronomic advice.